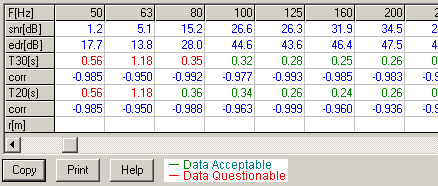
To check the quality of a measurement, go to Calculate->Reverb Times (RT-60) and you will see a table as shown below.
In the table above, you can check that the T20 and T30 numbers are similar.
The corr number indicates how linear the reverberation curve is and should be as close to 1 as possible.
The edr gives the effective range of the decay curves and based on this value the numbers are either given a green (Data Acceptable) or red (Data Questionable) color.
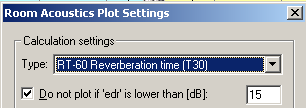
You may set WinMLS not to include the reverberation time number that have a too low edr value. To do this, click in the Reverberation Time plot, then click the F5 key to open the plot settings. In the figure below we see that the default edr value is set to 15 dB and the T30 is plotted. You may also set WinMLS to plot T20 instead of T30 if that is desired.