General – Waterfall CSD (loudspeaker)
Step 1 – Waterfall CSD
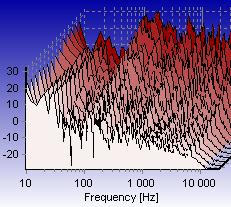 This setup is meant for displaying waterfall plots in CSD (cummulative spectral decay) mode.
The CSD mode that is used here is suitable for displaying loudspeaker measurements (impulse responses).
Load another setup for info on how to setup the sound card and to perform the measurement.
For more information about waterfall in general, see the help button.
Step 2 – Waterfall Plot Depth
If you do not see the waterfall plot, this may be because the Depth does not fit the length of the measurement.
Click help for info on how to set the depth of the Waterfall layout.
Step 3 – Waterfall Cursor Readout
 Click help for info on how to read out the cursor values from a waterfall plot.
Note: Use Plot→Solo Curve to remove the slices in front of the slice you want to read the values from.
You can also add a text box that will display the cursor values in the plot. To do this, go to Plot→Layout→Cursor Value.
Step 4 – Change Slice or Background Color
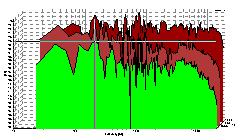
 As default, the waterfall slices start with a red color and then gradually changes to white.
You may change the the starting color from Plot→Layout→Curve Styles and Colors…
In this dialog box, click the color to the right of curve 1 as shown in the picture.
Then you can change to another color.
If you wish to change the background color, click help for information on how to do this.
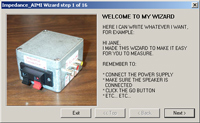
Step 5 – Customize the Wizard
 If you want to restart the Wizard, do this from Measurement→Wizard→Start.
You can easily edit the Wizard to include your own specific instructions from Measurement→Wizard→Editor….
Click help for more info.
If you want WinMLS to remember your settings, store the setup from Setup→Store….
Click the Finish button to exit this wizard.