Loudspeaker – Impedance
Step 1 – Impedance Measurement
 This wizard explains how to measure impedance using your own hardware.
You may alternatively purchase an active impedance interface (AIMI) directly from us.
The AIMI has been developed for optimal high quality impedance measurements and tested by leading loudspeaker manufacturers.
For more information, go to Setup→Load… and select the setup named Loudspeaker_Impedance with AIMI.
Click the Next > button to continue.
Step 2 – Theory
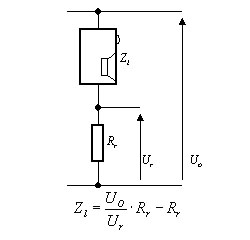 According to Ohms law, impedance is given by voltage divided by current. The current is measured by inserting a small reference resistor in series with the unknown impedance (Zl) as shown in the figure.
The value of Zl is given by the formula shown in the figure.
For loudspeaker measurements (4–8 Ohm), we recommend Rr = 1 Ohm. To obtain accurate results, Rr has to be a precision resistor or measured accurately. If you have equipment to measure Rr (including cables) accurately, we recommend using 0.1 Ohm.
Step 3 – Theory 2 - not required
The voltage drop (Ur) over Rr should be low compared to the output voltage (Uo). To meet this condition, Rr must be small compared to the impedance (Zl).
Zl is often matched with the output impedance of the amplifier, a large value Rr can damage this match.
Rr should be 10 to 100 times smaller than Zl. But if Rr is << 1 Ohm, the resistance of the cabling should be measured and compensated for.
Step 4 – Theory 3 - not required
Accurate results are obtained if Rr is a precision resistor, e.g. a 0.1 % accuracy metalfilm resistor.
If you do not have such a resistor, you may use an ordinary resistor and measure its value e.g. with a multimeter. Disconnected the resistor from the circuit while measuring its value. If the resistor value is small (< 1 Ohm), use a high-quality multimeter and include the cables.
The resistance value may change due to temperature variations. Thus the reference resistor should be measured at the same temperature as when performing the actual impedance measurements.
Step 5 – Insert reference resistor value
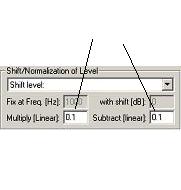 1. Go to Plot→Plot Type Settings→Active Plot… to open the settings dialog.
2. Find the Shift/Normalization of Level part to the lower left in the dialog (see figure). Enter the value of your resistor in Ohms as shown in the figure. Note that it must be entered at two places. In the figure the value is set to 0.1 Ohm.
3. Click the OK button to exit the dialog.
4. Go to Setup→Store As… and click the OK button to save the settings.
Step 6 – Equipment needed
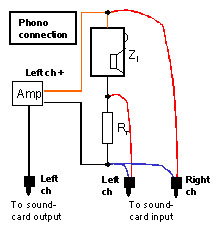 The figure shows how to connect the hardware. Use this figure if your sound card has phono plug connectors. Use the figure in the next wizard step is your sound card has mini-jack connectors.
The interface in the figure delivers 2 types of signals to the sound card:
1. Output signal from amplifier (Uo).2. Reference signal (Ur).
To calculate the impedance, WinMLS only needs these two signals and the value of Rr.
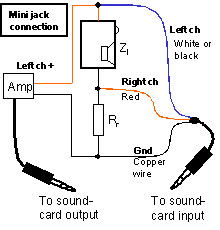
Step 7 – Connect equipment
This figure shows how to connect the hardware if your sound card has mini-jack connectors.
Warning, a high amplifier level may damage the soundcard. To avoid damage, follow the procedure below.
1. Set the amplifier volume as low as possible.
2. Connect the cables from the loudspeaker to the sound card input.
3. Connect the soundcard output to the amplifier input.
Step 8 – Turn off calibration
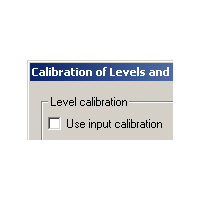 Go to: Measurement→Calibration…
Make sure the check box Use input calibration is NOT checked.
Input ch. 1 and ch. 2 must have equal sensitivity. Normally this is taken care of by turning off the calibration and setting equal input volumes for ch. 1 and ch. 2.
(If it is not possible to set equal sensitivity for ch. 1 and ch. 2, use calibration to adjust for this difference. This is done from Measurement→Calibration… by calibrating both input ch. 1 and input ch. 2 separately.)
Step 9 – Sound Card Settings
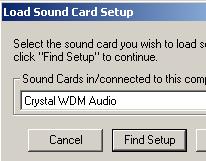 If you have not loaded the settings for your sound card, go to Setup→Load… and select your sound card in the list shown in the picture.
Click the Load button to load the sound card settings. After doing this, you must reload this setup.
If you cannot find your sound card on the list, click the Help button below. The help file will give you instructions on how to set up your sound card.
Step 10 – Setting digital output level
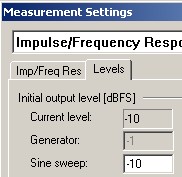 Although it is recommended if possible to adjust the analog output level, the digital output level can also be adjusted.
Go to Measurement→Settings…, click the Levels tab. If you can control the output level from the WinMLS mixer or an external mixer, set to -10 dBFs as shown in the figure. Click the Close button.
If you want to adjust the output level digitally, first set it to a low level: -50 dBFS. When you, in one of the following wizard steps, are told to increase the output level, increase the value in 10 dB steps.
Step 11 – Using external mixer
 Make sure Toolbars→Volume and Input Level(s) is checked. If the dialog is the same as shown in figure, WinMLS does NOT control the Window mixer. In this case, there will be two differences in the two following wizard steps:
1. The figures shown for the next two wizard steps should be the figure shown in this wizard step.
2. It is not possible to set any volumes from WinMLS. Set volumes either from an external software or hardware mixer.
Step 12 – Level adjustment (1 of 2)
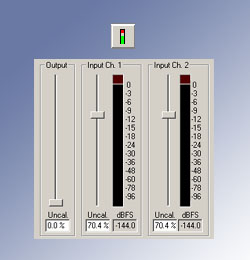 Warning! A very high sound card output signal may cause damage.
1. Set the output volume to minimum. If available, use the slider in the figure.
2. Set reasonable input volumes. If available, set the input volume slider between 0 dB (100 %) and approximately -12 dB (65 %).
Important! The input volumes for input ch. 1 and input ch. 2 must be set equal.
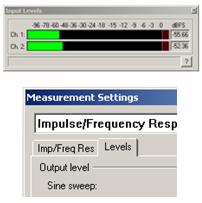
Step 13 – Level adjustment (2 of 2)
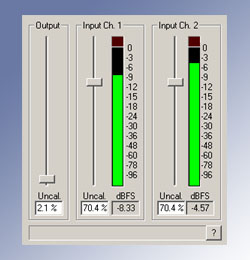 1. Go to Measurement→Test Levels to monitor the levels.
2. Increase the output level until the input level is between -30 dB to -3 dB on both inputs.
3. Make sure the sensitivities of input ch. 1 and ch. 2 are equal. Do this by swapping input ch. 1 and ch. 2 connectors. After swapping, the input levels must show show the same value. Remember to swap the channels back before measuring.
4. Go to Measurement→Start to perform a measurement.
Step 14 – Results
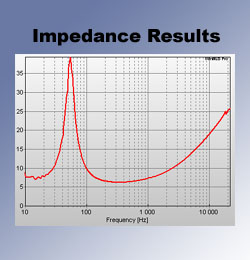 The figure shows the result of a typical 6 Ohm loudspeaker element impedance measurement.
To perform a new measurement, use Measurement→Start.
Click the Next > button for more information about saving, exporting data and improving results.
Step 15 – Low frequency measurements
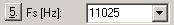 To measure at low frequencies, for example up to 1000 Hz it is recommended to set the sampling frequency as low as possible (most sound cards support 11.02 kHz, some even 8 kHz).
You may also adjust the sweep range. The upper limit must be set higher than the maximum frequency to be measured, e.g. set it to 1300 Hz if you want to measure up to 1000 Hz.
The sampling frequency and sweep range is set from Measurement→Settings… in step 5. as shown in the figure.
Step 16 – Improving result (1 of 2)
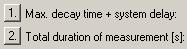 To increase the frequency resolution, increase the Max. decay time + system delay (step 1 in Measurement→ Settings…).
If the curve is noisy, the noise can be reduced by increasing the measurement duration (step 2 in Measurement→Settings…).
Smoothing can also be applied to reduce noise in the curve. Go to Measurement→Plot Type Settings→Active Plot… and make sure Use smoothing is checked.
Step 17 – Improving result (2 of 2)
 Increasing the FFT size (also called zero-padding) will also increase the displayed frequency resolution. Go to: Plot→Plot Type Settings→General Frequency Domain… and select the radio button Zeropad to.
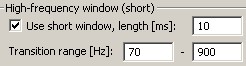
A separate high-frequency window can be used to reduce the noise at high frequencies without reducing the frequency resolution at low frequencies. In the Plot→Plot Type Settings→General Frequency Domain… dialog, click the button Time window settings for Active Measurement…. Make sure Use short window is checked as shown in the figure.
Step 18 – Saving/exporting data
 The curve data can be exported using File→Export Data… or Edit→Copy Data in Plot.
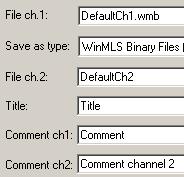
The raw data can be saved using File→Save As… shown in the figure. Two files will be saved.
If you want to change the default filename, remember to do it for both ch. 1 and ch. 2.
Click the Next > button below to see how saved raw data can be opened from WinMLS.
Step 19 – Opening raw data
 Here we explain how to plot the impedance based on saved raw data.
Two files must be opened.
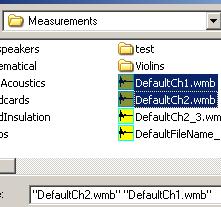
Do this from File→Open… as shown in the figure. One of the files should end with Ch1, the other should end with Ch2.
Use Plot→Refresh… to plot the data if they are not plotted automatically. From the legend list, check that the two measurements are divided by another.
Step 20 – Customize the wizard
 If you want to restart the Wizard, do this from Measurement→Wizard→Restart.
You can easily edit the Wizard to include your own spesific instructions from Measurement→Wizard Editor….
If you want WinMLS to remember your settings, store the setup from Setup→Store As….
Click the Finish button to exit this wizard.