Displays the dialog shown below.
All curves belonging to a measurement in the active plot are exported as columns. If  one-line header is included that
contains the title of each column. The axis is named x-axis, the data
column(s) are given the name of the series title (maximum 30 characters). The
character Tab is used as column separator in the header as well as for the
data.
one-line header is included that
contains the title of each column. The axis is named x-axis, the data
column(s) are given the name of the series title (maximum 30 characters). The
character Tab is used as column separator in the header as well as for the
data.
If  is
checked, each curve will have each own vertical axis. If WinMLS is displaying
multiple plots and if
is
checked, each curve will have each own vertical axis. If WinMLS is displaying
multiple plots and if  is
checked, the data from all plots will be exported.
is
checked, the data from all plots will be exported.
If  is
checked, the curve data from all the plots in WinMLS are merged. This is useful
e.g. if you are plotting the magnitude frequency response in one plot and the
phase response in another plot and want to export a file that consists of the
frequency as the first column, the magnitude as the second row and the phase as
the third row.
is
checked, the curve data from all the plots in WinMLS are merged. This is useful
e.g. if you are plotting the magnitude frequency response in one plot and the
phase response in another plot and want to export a file that consists of the
frequency as the first column, the magnitude as the second row and the phase as
the third row.
If the x-axis is not the same for all curves in the plot, an x-axis is constructed that contains all the x-axis values for all the curves. This is the case e.g. if the sampling frequency is not the same, or if a value is missing e.g. when plotting reverberation time and the effective-decay-range is not good enough to compute a value. If a y-value does not exist at a certain x-value, no text is written to indicate that it is not a number.
If  is
checked, this dialog will be displayed before the data is sent to clipboard on
Edit->Copy Data
.
is
checked, this dialog will be displayed before the data is sent to clipboard on
Edit->Copy Data
.
 Contents
 Index
Index Search
 Previous
 Next
Next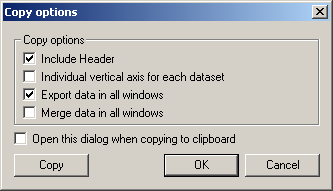
 button to copy the data to the clipboard.