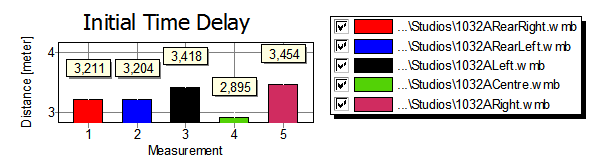
The plot type Parameters has this option for plotting Delay/Distance as shown in the figure above. The algorithm detects where the impulse response starts (the maximum of the impulse response is detected and the delay is set to that value).
In this example, the delay/distance is displayed in meters. This can be changed e.g. to milliseconds from the Plot->Plot Type Settings->Time Data dialog. In this dialog, make sure milliseconds is selected as horizontal axis instead of meters.
 Contents
 Index
Index Search
 Previous
 Next
Next