Exports plotted curve(s) as data columns in a text-file.
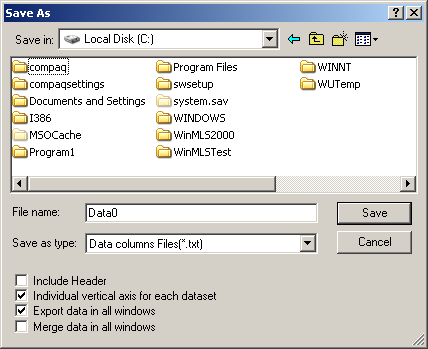
All curves belonging to a measurement in the active plot are saved as columns. If  one-line header is included that
contains the title of each column. The axis is named x-axis, the data
column(s) are given the name of the series title (maximum 30 characters). The
character Tab is used as column separator in the header as well as for the
data.
one-line header is included that
contains the title of each column. The axis is named x-axis, the data
column(s) are given the name of the series title (maximum 30 characters). The
character Tab is used as column separator in the header as well as for the
data.
If  is
checked, each curve will have each own vertical axis. If WinMLS is displaying
multiple plots and if
is
checked, each curve will have each own vertical axis. If WinMLS is displaying
multiple plots and if  is
checked, the data from all plots will be exported.
is
checked, the data from all plots will be exported.
If  is
checked, the curve data from all the plots in WinMLS are merged. This is useful
e.g. if you are plotting the magnitude frequency response in one plot and the
phase response in another plot and want to export a file that consists of the
frequency as the first column, the magnitude as the second row and the phase as
the third row.
is
checked, the curve data from all the plots in WinMLS are merged. This is useful
e.g. if you are plotting the magnitude frequency response in one plot and the
phase response in another plot and want to export a file that consists of the
frequency as the first column, the magnitude as the second row and the phase as
the third row.
If  is not
checked and the x-axis is not the same for all curves in the plot, an x-axis is
constructed that contains all the x-axis values for all the curves. This is the
case e.g. if the sampling frequency is not the same, or if a value is missing
e.g. when plotting reverberation time and the effective-decay-range is not good
enough to compute a value. If a y-value does not exist at a certain x-value, no
text is written to indicate that it is not a number.
is not
checked and the x-axis is not the same for all curves in the plot, an x-axis is
constructed that contains all the x-axis values for all the curves. This is the
case e.g. if the sampling frequency is not the same, or if a value is missing
e.g. when plotting reverberation time and the effective-decay-range is not good
enough to compute a value. If a y-value does not exist at a certain x-value, no
text is written to indicate that it is not a number.
If is
checked, then you should check if the axis is correct if  is not checked.
For a more advanced method of exporting, see Edit->Advanced Export....
These exporting procedures are slow if data with more than 30000 points are to be exported. Therefore, if you want to export the frequency response, you should turn on smoothing to reduce the size of the data (make sure interpolate back to original data points is turned off). If you want to save the raw time data we recommend that you use the File->Save As... procedure and use the .wmt format. This will save the raw time data in a text file with a short header.
 Contents
 Index
Index Search
 Previous
 Next
Next