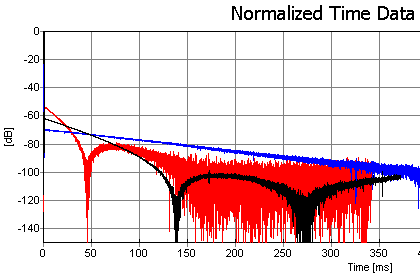
You can also perform a test measurement to set these parameters. Then you can e.g. plot the reverberation time to see if the decay time you guessed was correct. You can also plot the impulse response using dB as y-axis. In the figure below, 3 sound card electrical loop-back measurements are shown. We see that for the red curve the noise floor is reached after 150 ms. For this measurement 0.15 s can be used.
For the two other curves, the noise floor has not been reached within the 350 ms range that is displayed.