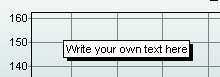
This will explain how to add cursor values or custom text such as your own comments to the plots, and example is shown below for custom text.
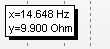
One of the text boxes you add to the plot, will be used to display the cursor value as shown in the figure below.
Therefore, if you only add one text box it will be used for the cursor values. If you wish to add a box with your own text you need to add two Annotation boxes as will be explained below.
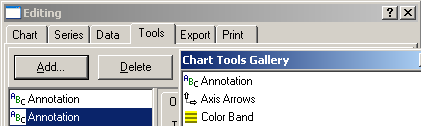
In Plot->Layout->Edit..., click on the
Tools tag as show in the figure below. Then click the  button. From the list select
 and click the
  button. If you want to add
your own text, do this operation twice to add two Annotation tools.
button. If you want to add
your own text, do this operation twice to add two Annotation tools.
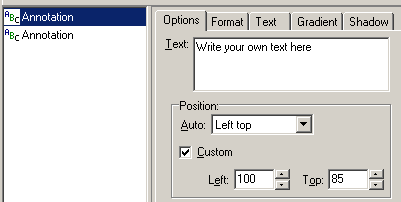
If you want to type your own text, select the upper Annotation tool as shown below, (if you pick the lower Annotation the text will be replaced by the cursor values)
Then type your text in the Text field as shown below.
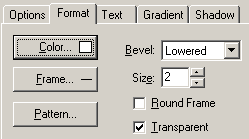
Important: To display the annotation in the plot, you must
make sure  is checked as
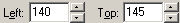
shown in the figure above. Then set the position of the text box by adjusting
the left and top values
is checked as
shown in the figure above. Then set the position of the text box by adjusting
the left and top values
While you adjust these, you should see the text box moving around in the plot.
Note that you may format the text in many ways, for example
it can be made transparent by checking  shown below.
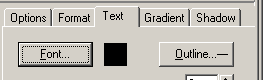
The font can be changed from the Text tab by clicking
the  button shown
below.
button shown
below.
 Contents
 Index
Index Search
 Previous
 Next
Next