The defaults curve style can be changed in Plot->Layout->Curve Styles and Colors .
Note: These changes will not apply before you delete the curves in the plot and plot them again.
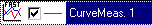
If you just want to change the curve styles in the current plot, then go to Plot->Layout->Edit.... If you want to change the color only, click on the curve to the left of the series title, the red horizontal line shown in the figure below.
(You can do the same also from the List of Curves toolbar, see View->List of Curves).
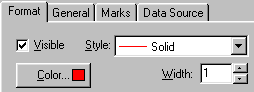
If you want to display the style settings, double-click on the curve title (CurveMeas. 1 shown in the figure above). If the curve type is FastLine, the settings shown below will be displayed.
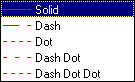
From the Style list the options shown in the figure below can be selected. These are especially useful if plotting several lines and colors are not allowed. Note that if the curve width is larger than 1, the style can only be solid.
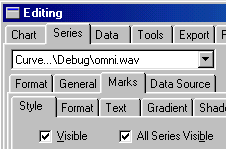
To display the value for each point, marks must be set to visible. This is set from Plot-> Layout->Edit... as shown in the figure below. First select the series, then the Marks tab. In the Style tab, make sure the Visible check box is checked.
 Contents
 Index
Index Search
 Previous
 Next
Next