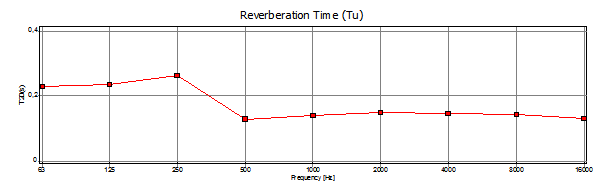
As default the horizontal axis labels display the octave band values as shown below.
It is, however, possible to change the axis labels and gridlines.
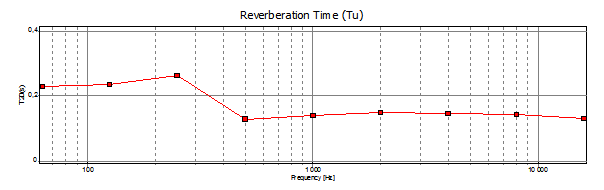
It will now be explained how to change the axis to an ordinary logarithmic axis as shown above (if you want to switch back again, you need to do exactly the opposite of the description below).
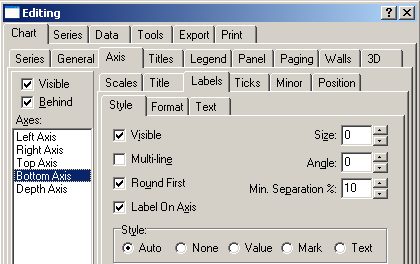
Click on axis in the Room Acoustics plot type. It will display the dialog box shown below. Click on the Axis tag, then the Labels tag. Then at the axis list at left select Bottom Axis.
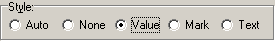
Now change the Style from Auto to Value as shown below.
Note that when a room acoustics parameter is plotted with bandwidth Broadband, the style should be set to Value. If not, the x-axis labeling will not be correct.
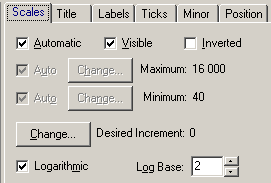
Now select the Scales tag as shown below:
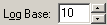
Now we need to change the Log Base from 2 to 10 as shown below.
 Contents
 Index
Index Search
 Previous
 Next
Next