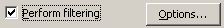
You can filter the time data in WinMLS. If your active plot type is a time domain plot type (Time Data, Integrated Time Data, Energy-Time Curve or Schroeder Curve) this can be turned on from Plot->Plot Type Settings->Active Plot as shown in the figure below
Make sure the  check box is checked. Click the
  button to display the dialog box
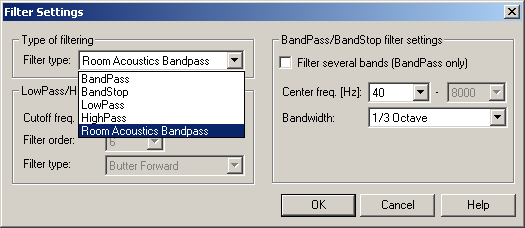
shown below where you can select the filter frequency.
button to display the dialog box
shown below where you can select the filter frequency.
Note: A faster way of filtering is to use the
Active Plot Type Toolbar. The buttons  can be used to shift the filter
frequency up and down and to access the filter settings.
can be used to shift the filter
frequency up and down and to access the filter settings.
 Contents
 Index
Index Search
 Previous
 Next
Next