You can set WinMLS to plot data only in a specified range, e.g. 100-5000 Hz.
To limit the plotting range, go to Plot->Layout->Advanced... and in this dialog box, you can specify what points you wish to include in the plot as shown below.
If you wish to plot in the range 100-5000 Hz, you need to find the point that corresponds to 100 Hz and the point that corresponds to 5000 Hz.
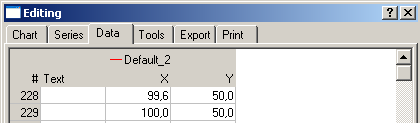
To do this, go to Plot->Layout->Edit... and click the Data tag shown in the figure below. Now use the vertical scroll bar to scroll down to X value equal to 100 shown in the figure below, we see that it corresponds to point number 229.
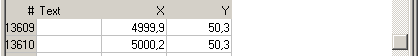
If we use the scroll bar to scroll further down we see that 5000 Hz corresponds to number 13610 as shown in the figure below..
Now go to Plot->Layout->Advanced... and in this dialog box, you can specify these points we found as shown below.
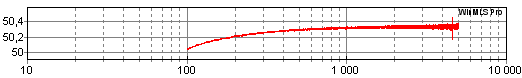
The result is now a frequency response plot as shown below.
Remember to store the setup from Setup->Store... if you want to store this setting.
You can do this for all plot types. For an example on how to do it for the Room Acoustics plot type, in the Measurement walk-through section see the section Limit the plotting range, e.g. plotting only in the range 100-5000 Hz.
Warning: This setting applies for all plot types so if you set the window to display the time data, only points in the range 229-13610 will be plotted in all the plots in the active window. Therefore if you want to display multiple plots while using this feature you should use Window->New Window... to add new windows where the settings are independent on each other.
 Contents
 Index
Index Search
 Previous
 Next
Next