In this application we want to measure the loudspeaker directivity as function of frequency.
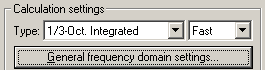
To do this we start by loading the setup named Loudspeaker_Near Field. We want the results in third-octave bands, to do this, go to Plot->Plot Type Settings->Frequency Response/Spectrum and select the setting shown below.
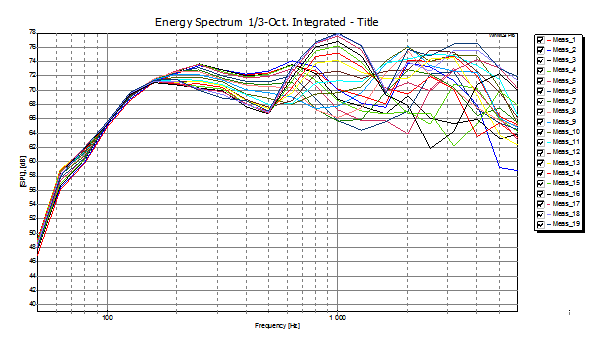
We have measured the loudspeaker in 5 degrees steps in one plane from 0 to 180 degrees. This gives 18 measurements as shown in the figure below.
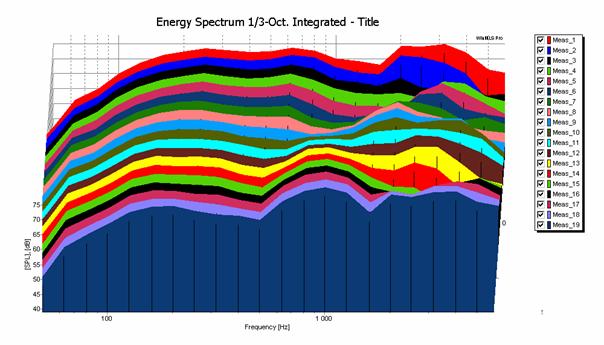
To see the directivity more clear as function of position, we want to display this in a 3D plot as shown in the figure below. From this figure we see that the frequency response has a dip at 500 Hz and a peak at about 1000 Hz for Meas_13 to Meas_19.
The settings for obtaining this plot will not be explained. The plot range is set to 50-6000 Hz in the Plot toolbar as shown below.
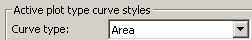
Go to Plot->Layout->Curve Styles and Colors to change the line style to Area as shown below.
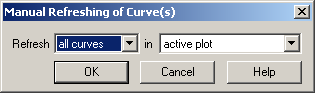
You may have to go to Plot->Refresh and select the setting below to refresh the curves with this setting.
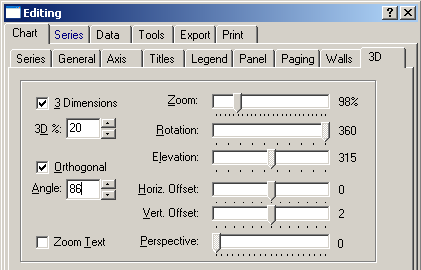
Now go to Plot->Layout->Edit and select the 3D tag and other settings shown in the dialog box below.
 Contents
 Index
Index Search
 Previous
 Next
Next