This is a step-by-step description on how to set adjust the equalizer based on measurements in many positions. This can be applied to the sound systems/PA in for example movie theaters and underground stations.
A short description: Measurements are perfomed in a number of positions and averaging is applied to obtain a spatially averaged frequency response. We want to flatten this spatially averaged curve since a flat curve should sound better.
To make this as fast as possible, we dont want to measure all 10 positions again if we change the EQ settings, but only perform one measurement.
To make this as simple as possible, we want WinMLS to show us a flat curve when the EQ is correctly tuned. (From this curve we also want to be able to read out the dB-value we need to adjust each band.)
To obtain this, this spatially average response is inverted and used as a compensation in the measurement system.
We also must do one of the following
Either: Form a loop back with the equalizer only and perform measurements while adjusting the EQ settings until we smooth the inverted average response. The equalizer is then re-inserted into the system.
Or: If you do not have access to the EQ output signal you can do this. Set the last measurement as reference. Perform measurements while adjusting the EQ settings until we smooth the inverted average response.
As result we have a reasonable smoothed average spatial frequency response.
Level calibration is not reqired for this application since it is based on comparing measurements. But if you are using a microphone that is not flat, this should be compensated.
1. Go to Setup->Load to load a setup that plots the frequency response with correct settings, we recommend Sound System_Adjust Before Performance.
2. Make sure Plot->Overlay is checked.
3. Make sure the EQ of your sound system is turned off.
4. If
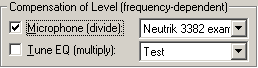
your microphone needs compensation, make sure this compensation is turned on. To
do this go to Plot->Plot Type
Settings->Frequeny Response/Spectrum
or click F5. In this dialog
box, select the compensation file for your microphone and turn on the  compensation as shown below.
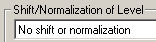
In the same dialog, make sure that no shift or normalization is turned on as shown below.
5.
Perform a number of measurements in different positions (measure with the
equalizer turned off at N different locations). Since Plot->Overlay
is checked, the curves will be plotted on top of each other and when
finished there will be N curves displayed. In the figure below
N=10.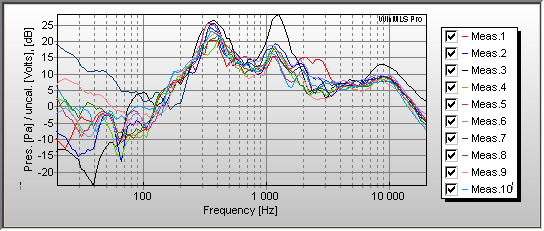
6. Click
the  button to display the
mean value on top of all the plotted curves. The average room response
button to display the
mean value on top of all the plotted curves. The average room response  (average magnitude
response) is then calculated.
(average magnitude
response) is then calculated.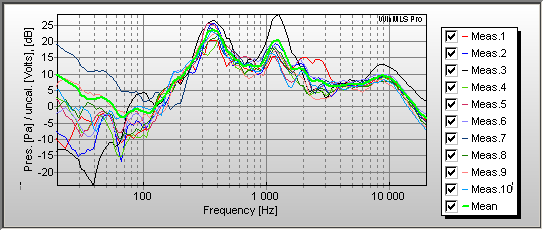
7. Click
the  button to display the
average curve
button to display the
average curve  only. (If
not only the mean value is plotted, go to Plot->Overlay
and make sure
that
only. (If
not only the mean value is plotted, go to Plot->Overlay
and make sure
that  is
selected.)
is
selected.)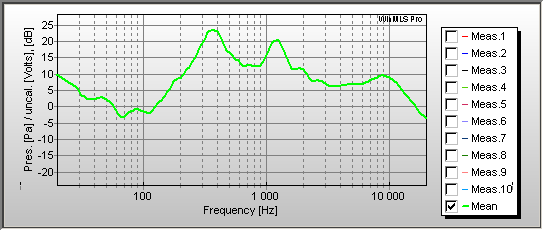
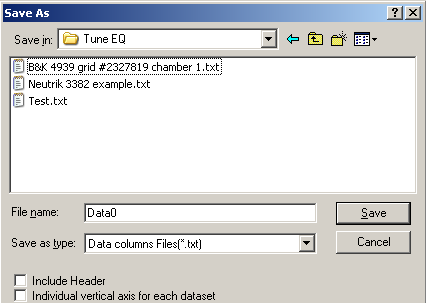
8. Now we want to save this inverted curve to use it later. Go to File->Export Data and find the folder where WinMLS was installed. Then find the subfolder named Tune EQ. Make sure the settings are set as shown in the dialog box below.
9. To set
this curve as reference, go to Plot->Plot Type Settings->Frequeny
Response/Spectrum
or click F5. In this dialog box, select the file
you just saved (Data0) and turn on the  compensation as shown below.
If you do step
10 below, also make sure the microphone compensation is turned off  .
.
If you instead do step 11 below, the microphone compensation should not be changed.
10. You can
either do this step or the next step: Form a loop-back with the equalizer
only. In other words, connect the measurement system to the loudspeaker only and
leave out the microphone and the loudspeakers.
(When we perform another
measurement of the loop-back with the equalisation applied  , we then display the curve
 which is the
equalizer response
which is the
equalizer response  multiplied with the average room response .)
11.
Do this step if you have not done the previous step: If you dont have
access to the equalizer output, make sure the microphone is in the last
measurement position. We will use the measurements in this position to tune the
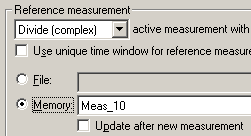
equalizer. To do this correctly, we need to divide by the measurement performed
in this position. Find the Active Plot Toolbar and make sure it is set as shown
below.
If
you alternatively want to set this from a dialog box, go to Plot->Plot
Type Settings->Frequeny Response/Spectrum
or use Ctrl + F and
make sure this measurement is selected as shown in the figure below (in this
example Meas. 10 was the last measurement position that is therefore set
as reference)
Make sure that the check box  is not checked.
(When we perform another
measurement with the equalization applied  , we display the curve
 which is the
equalizer response
which is the
equalizer response  multiplied by the average room response .
Alternative: This operation
could have been done after step 5 instead of here. If this has been done, you
must not use any reference measurement in this step so in this case make sure
 is selected. This will speed
up the calculation somewhat.)
is selected. This will speed
up the calculation somewhat.)
12. In the
previous steps the reference is set. Now it is time to clean up after this. Make
sure the buttons are turned off as shown in the figure.
To remove the measurements needed
to make the reference, click the  button and select the settings shown in the figure below (this
will remove all the curves in the plot and remove the measurements from
memory)
button and select the settings shown in the figure below (this
will remove all the curves in the plot and remove the measurements from
memory)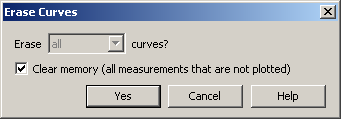
13. Perform measurements and tune the EQ so the curve is as flat as possible. When the curve is reasonably flat, this procedure is finished.
14. When finished, you might want to reload the setup. Or alternatively turn the microphone compensation off or select the compensation file for your microphone. Do this from Plot->Plot Type Settings->Frequeny Response/Spectrum .
 Contents
 Index
Index Search
 Previous
 Next
Next