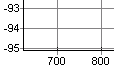
Gridlines as shown in the plot below can be turned on/off from Plot->Layout->Gridlines.
Note: When the Plot->Layout->Edit... dialog box is opened, the current gridlines are displayed even if they are turned off.
Note: If the plot type is Frequency response/Spectrum, Phase response/Function, Group delay, Waterfall or Levels and if the x-axis is logarithmic, some of the gridline settings are not user changeable.
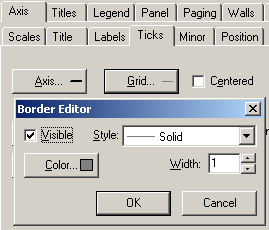
To modify the gridlines; in
Plot->Layout->Edit... select the Axis tag. Then select the
axis where you want to modify the gridlines from the list (Left Axis or
Bottom Axis). Click on the Ticks tag. Finally click on the  button and turn on the
  check box.
Minor gridlines are available from the Minor tag, found at the right side of the Ticks tag.
 Contents
 Index
Index Search
 Previous
 Next
Next