Displays the dialog shown below.
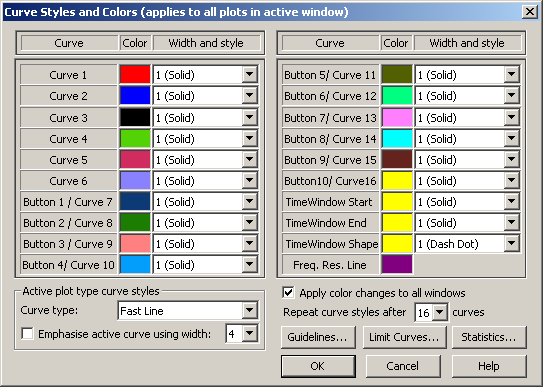
The upper part of the dialog shown above sets the default color, width and style for the curves plotted by WinMLS. Curve 1 is the first curve plotted, and from the figure above we see that this has red color. The second curve to be plotted will have blue color, etc...
Below Curve 6 in the figure above, we see that the next is
named  . Button 1 refers to the
first button in the Measurement Panel toolbar.
This means this color is used for button 1 in the Measurement Panel toolbar (as
shown in the figure below) but also as the seventh curve in the plot.
. Button 1 refers to the
first button in the Measurement Panel toolbar.
This means this color is used for button 1 in the Measurement Panel toolbar (as
shown in the figure below) but also as the seventh curve in the plot.

 Selecting curve width and style
 Contents
 Index
Index Search
 Previous
 Next
Next