
Displays the dialog shown below (in this case 3 measurements are performed and the Time Window is displayed in the plot).
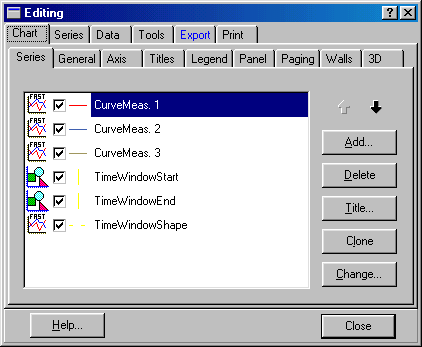
This dialog gives the user a wide range of possibilities and
may seem complicated. Note that this dialog has context-sensitive help
functionality. Click the question mark button  in the upper right corner and
then click the setting you want explained.
in the upper right corner and
then click the setting you want explained.
The settings of this dialog are saved as chart files and are controlled by the post-processing setup. Each plot type has chart files that are opened when the plot type is selected. The chart files are found in the Chart subfolder in the folder where WinMLS is installed as shown below.
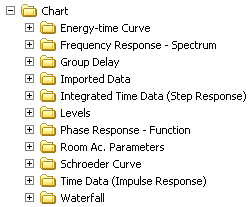
Note that changes to the plotted curve, e.g. changing colors, will not be saved. Default curve styles are set in Plot->Layout->Curve Styles and Colors .
Now each tab page as shown in the figure below will be described, starting with the Chart page.

 Contents
 Index
Index Search
 Previous
 Next
Next