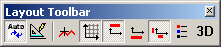
The layout toolbar contains frequently used layout settings.
 Plot->Auto-Refresh.... Determines whether auto refresh is
turned on or off.
Plot->Auto-Refresh.... Determines whether auto refresh is
turned on or off.
 Plot->Layout->Edit.... Display settings
 Plot->Layout->Cursor. Display cursor in plot.
 Plot->Layout->Gridlines. Display gridlines in plot. This and other
gridlines settings are found in Plot->Layout->Edit...,
select the Axis tab, then select the Ticks tab, or the
Minor tab for the minor gridlines.
Plot->Layout->Gridlines. Display gridlines in plot. This and other
gridlines settings are found in Plot->Layout->Edit...,
select the Axis tab, then select the Ticks tab, or the
Minor tab for the minor gridlines.
 Plot->Layout->Title. Display title in plot. This and other title
settings are found in Plot->Layout->Edit..., select the
Titles tab.
Plot->Layout->Title. Display title in plot. This and other title
settings are found in Plot->Layout->Edit..., select the
Titles tab.
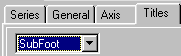
 Plot->Layout->Footer. Display footer in plot. This and other
comment settings are found in Plot->Layout->Edit..., select
the Titles tab. Then select SubFoot as shown in the figure
below.
Plot->Layout->Footer. Display footer in plot. This and other
comment settings are found in Plot->Layout->Edit..., select
the Titles tab. Then select SubFoot as shown in the figure
below.
 Plot->Layout->Axis Labeling. Display labels in plot. This
and other label settings are found in Plot->Layout->Edit..., select
the Axis tab. Then select the Labels tab.
Plot->Layout->Axis Labeling. Display labels in plot. This
and other label settings are found in Plot->Layout->Edit..., select
the Axis tab. Then select the Labels tab.
 Plot->Layout->Legend. Add legend to active plot. This and other legend settings
are found in Plot->Layout->Edit..., select the Legend
tab.
Plot->Layout->Legend. Add legend to active plot. This and other legend settings
are found in Plot->Layout->Edit..., select the Legend
tab.
 Plot->Layout->3D. Show the plot in 3D. This and other 3D
settings are found in Plot->Layout->Edit..., select the 3D
tab.
Plot->Layout->3D. Show the plot in 3D. This and other 3D
settings are found in Plot->Layout->Edit..., select the 3D
tab.
 Contents
 Index
Index Search
 Previous
 Next
Next