The linear sum of 1/3-octave frequency bands is computed and displayed. The frequency range is determined in the 1/3 octave frequency range settings.
If the measured data is a transfer
function (for example measured with MLS output
signal), the data are corrected for the output signal so that the value for the
input only is computed. This makes it possible to plot the input level and is
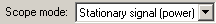
why it is called scope mode. Two
types of scope mode is supported, either Stationary signal (power) or
Transient signal (energy). The scope mode settings are found in the lower
right of the dialog box displayed after clicking  as shown in the figure below.
If you are measuring impulse responses, Transient signal (energy) should be selected.
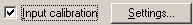
Note that the correct absolute value is given only if the absolute level of the input is calibrated. In Measurement->Calibration...., click the Settings... button as shown below.
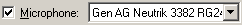
Note also that if Microphone compensation is turned on in Plot->Plot Type Settings->Frequency Response/Spectrum... as shown below,
then microphone compensation will also be used in when computing the frequency response for the Parameter plot type.
 Contents
 Index
Index Search
 Previous
 Next
Next