If the  check box shown below is checked, values of parameters that have
an effective-decay-range (edr) that
is less than the number specified below will not be displayed.
check box shown below is checked, values of parameters that have
an effective-decay-range (edr) that
is less than the number specified below will not be displayed.
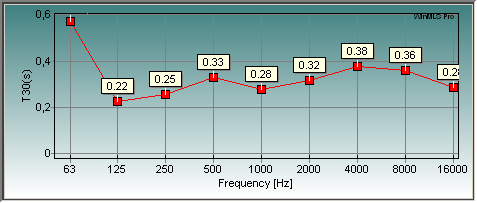
If  is
checked and
is
checked and  is not checked,
the value of the parameter is added as marks above the plot points as shown in
the figure below.
is not checked,
the value of the parameter is added as marks above the plot points as shown in
the figure below.
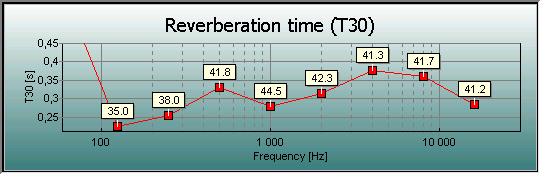
Alternatively, the edr can be displayed in the plot as
numbers in the plots as shown in the figure below if and  are both checked.
 Contents
 Index
Index Search
 Previous
 Next
Next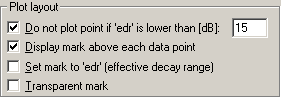

 is
checked, the mark is transparent and not yellow.
is
checked, the mark is transparent and not yellow. Yellow
mark:
Yellow
mark: 