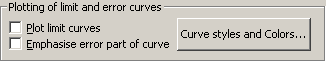
These settings determine the layout in the plot.
If you want to display the limit curve in the plot, make sure
that  is checked.
If  is
checked, the part of the curve that is outside the specified limits will be
given a different color and line style. The colors and line styles is set
clicking the button shown below.
is
checked, the part of the curve that is outside the specified limits will be
given a different color and line style. The colors and line styles is set
clicking the button shown below.
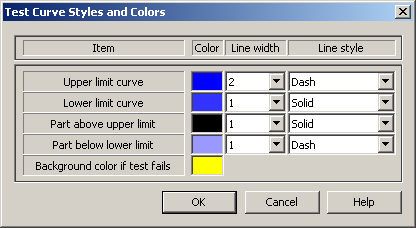
Clicking the  button will display the dialog shown below for setting curve
styles and colors.
button will display the dialog shown below for setting curve
styles and colors.
The color of the curves is set by
clicking at the color field  . The
line width is selected from the line width
. The
line width is selected from the line width  list box. The line style is selected from the line style list box
 .
.
 Contents
 Index
Index Search
 Previous
 Next
Next