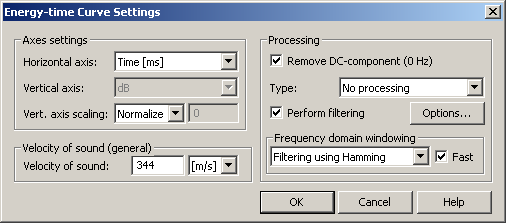
Displays the dialog box shown below
Most of the Energy-time Curve settings and explained in the
Plot->Plot Type
Settings->Time Data....
section. The Energy-time Curve the vertical axis can only be plotted in
dB. The vert. axis scaling is here set to  which is the most common way to
view the Energy-time Curve. The Frequency Domain Windowing settings are
also unique for this plot type and are explained
below.
which is the most common way to
view the Energy-time Curve. The Frequency Domain Windowing settings are
also unique for this plot type and are explained
below.
 Contents
 Index
Index Search
 Previous
 Next
Next