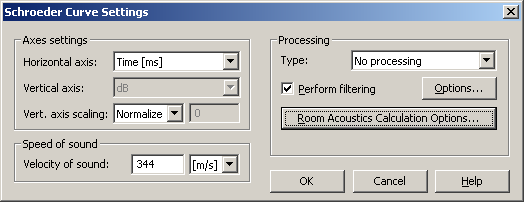
Displays the dialog box shown below.
Most of the Schroeder Curve settings are found and explained
in the Plot->Plot Type
Settings->Time Data....
section. The Schroeder Curve vertical axis can only be displayed in dB.
The vert. axis scaling is here set to  which is the most common way to view the Schroeder Curve. The
DC-component is automatically removed for the Schroeder curve and it is computed
from the last 50% of the measurement data. The
which is the most common way to view the Schroeder Curve. The
DC-component is automatically removed for the Schroeder curve and it is computed
from the last 50% of the measurement data. The  button will open the Advanced
Calculation Options. They are explained in the Advanced Calculation
Options section of the Calculate->Calculation Options...
documentation.
button will open the Advanced
Calculation Options. They are explained in the Advanced Calculation
Options section of the Calculate->Calculation Options...
documentation.
 Contents
 Index
Index Search
 Previous
 Next
Next