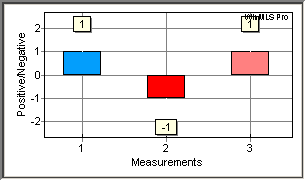
The polarity plots the value 1 if the polarity is positive and the value -1 if the polarity is negative. In the figure below, 3 measurements are plotted, the blue has positive polarity, the red has negative polarity and the pink has positive polarity.
The polarity check is simply performed by computing the maximum and minimum values of the time data and comparing these.
Note: Under difficult conditions this check may not always give the correct result. To be sure, you should inspect the impulse response manually.
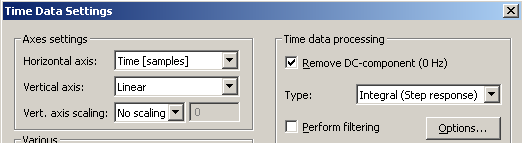
You can select that you want to calculate the polarity from the impulse response. Or you can set WinMLS to first compute the step response before computing the polarity. This is set from the Time Data plot settings and will be explained below.
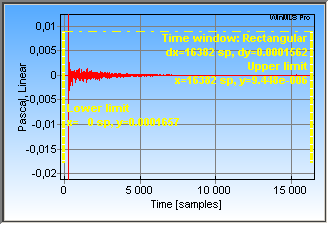
The polarity testing also depends on the Time Data time window. Therefore it is important that you make sure that the time window is set so that the part you want to use for the polarity check is included in the time window as shown in the figure below (<Ctrl>+<Shift>+<w> opens the time window settings).
You can also perform calculations on the impulse response,
the most used operation is to integrate it to obtain the step response. Click
F5 while the Time data plot is active to open the plot type settings (if the time data plot is not
displayed, you can toggle the  button on the Plot Toolbar to display one more plot, and select the
Time Data plot type in this plot).
button on the Plot Toolbar to display one more plot, and select the
Time Data plot type in this plot).
The type in the figure above should either be set to No processing or Integral (Step response) as the example above
Note that the other settings (DC-component and filtering) will also be included when finding the polarity.
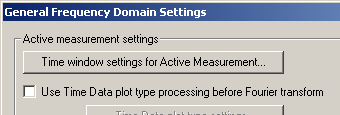
If you do not want this to be included when finding polarity
but do want it in the Time Data plot, you can turn it off from
Plot->Plot Type Settings->General Frequency Domain
, make sure  is turned off as shown below.
 Contents
 Index
Index Search
 Previous
 Next
Next