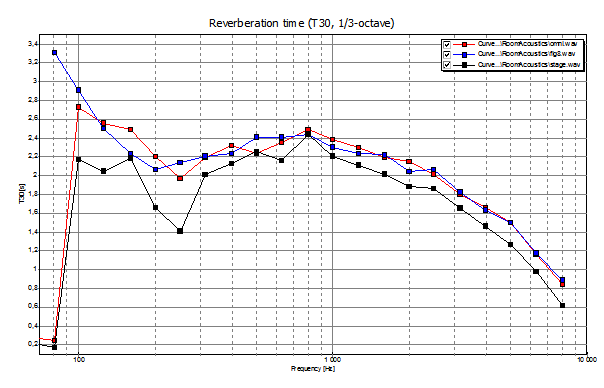
Use Edit->Copy Plot to copy a plot to clipboard. This can easily be pasted to programs such as MS Word. An example of three measurements plotted on top of each other in WinMLS and exported to MS Word using this method is shown below.
The one-third octave band data can be saved to a text-file using File->Export Data... (shortcut Ctrl+E). An example of the result when exporting two curves is shown below. The x-axis is the frequency axis.
x-axis Curve...\RoomAcoustics\omni.wav Curve...\RoomAcoustics\stage.wav
 Contents
 Index
Index Search
 Previous
 Next
Next