The easiest method is simply to do many measurements and
average the result. To do the average, first make sure that
Plot->Overlay
is checked. If you click in the STI plot and then click
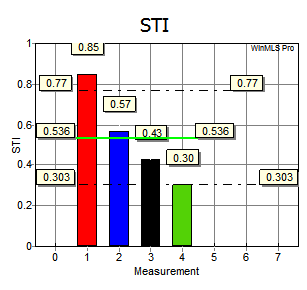
the  button, the mean value
for the displayed measurements will be displayed in the green line as shown in
the figure below. The STD is also displayed as the two dash-dotted lines.
button, the mean value
for the displayed measurements will be displayed in the green line as shown in
the figure below. The STD is also displayed as the two dash-dotted lines.
A solution here may also be to increase the duration of the measurement, e.g. to 30 seconds. This will average out the variations of the background noise.
 Contents
 Index
Index Search
 Previous
 Next
Next