General – Freq. and Time Response
Step 1 – Resposta frequencial e temporal
![]() Este wizard irá guiá-lo na utilização do WinMLS para que represente a resposta temporal e frequencial.
Este wizard irá guiá-lo na utilização do WinMLS para que represente a resposta temporal e frequencial.
O gráfico inferior representa a informação temporal (estacionária ou impulsiva).
Clique o botão help para ter um exemplo da utilização deste setup para a medição da placa de som.
Step 2 – Scope Mode
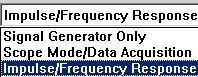 Para seleccionar outro tipo de medição, vá a Measurement→Settings…, como na imagem à esquerda.
Este setup apresenta por defeito a Resposta Frequencial e Temporal. O Modo de Aquisição significa que apenas o sinal de entrada é representado.Embora Resposta Frequencial e Temporal esteja seleccionado, é ainda possível representar o resultado Scope Mode. Isto significa que o nível do sinal é medido (i.e. SPL) e não o ganho do sistema (função de transferência). Para mais informação clique no botão help.
Step 3 – Smoothing the Upper Plot
 The upper plot displays the frequency response.
To turn off smoothing, if you have Level 4 of the software or higher, use the button in the picture. It is found to the lower right.
If you cannot find this button, you can turn on smoothing from Plot→Plot Type Settings→Frequency Response/Spectrum…. Make sure the Smoothing check box is checked.
Step 4 – Low Frequency Measurement
![]() If you want to measure low frequencies only, go to Measurement→Settings…. Make sure the 'Imp/Freq Res" tab is checked.
If you want to measure low frequencies only, go to Measurement→Settings…. Make sure the 'Imp/Freq Res" tab is checked.
Click help for information on how to set do this.