Loudspeaker – Harmonic Distortion
Step 1 – Harmonic Distortion (THD)
 This setup explains how to use the fastest method available today for measuring harmonic distortion components and/or THD as function of frequency (see picture).
The method is based on a sine sweep. Click help for more information.
If you instead want to measure THD for a single sinusoid, load the setup named General_Harmonic Distortion .
Click the Next > button to continue.
Step 2 – About this Wizard
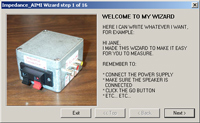
![]() This wizard contains quite a few steps, still we recommend that you go through all the steps.
This wizard contains quite a few steps, still we recommend that you go through all the steps.
Since this is a new method, some general recommendations are given in the first wizard steps.
At the end of this wizard, we will explain how to automatically increase the output level. A limit curve can be specified to notify the user when the distortion level is too high. This can be used for quality control testing.A setup wizard for adjusting limiters is planned.
Step 3 – Sound Card Settings
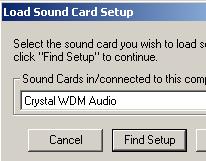 If you have not loaded the settings for your sound card, go to Setup→Load… and select your sound card in the list shown in the picture.
Click the Load button to load the sound card settings. After doing this, you must reload this setup.
If you cannot find your sound card on the list, click help. The help file will give you instructions on how to set up your sound card.
Step 4 – Sound Card Distortion
![]() If it is the first time you use this wizard, start by measuring the harmonic distortion (HD) of your sound card. Connect the output directly to the input (using a cable).
If it is the first time you use this wizard, start by measuring the harmonic distortion (HD) of your sound card. Connect the output directly to the input (using a cable).
You should use these sound card HD measurements to set optimal input/output volumes and determine the minimum HD that can be measured using your sound card.
Note: Some sound cards give high HD values if used at very high input/output volumes. If this is the case, reduce the input/output volume.
Step 5 – Measuring Sound Systems
 If you are measuring the (T)HD of a loudspeaker/microphone, place the microphone very near the loudspeaker (2 cm/1 inch). This will minimize the effect of the room reflections and decay.
If the microphone is positioned at a large distance from the loudspeaker, a small change in position may cause a large change in the measurement result because of room reflections.
If you are measuring the (T)HD of a complex sound system, it may be too time consuming to measure all loudspeaker elements. You can then measure only some of the elements.
Step 6 – Adjust Levels
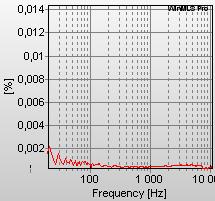 Go to Measurement→Test Levels to monitor the input level. Adjust the volumes so the input is not clipping (-30 to -1 dBFS). Clipping will increase the HD and must be avoided.
An example of a loopback measurement of a Lynx2 sound card is shown in the figure. See the next wizard step on how to adjust the upper axis limit scaling.
After setting the volumes, go to Measurement→Start to perform a measurement.
Step 7 – Adjust the Axis
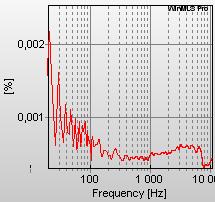
The upper and lower axis limits are set to auto-scaling as default. This may explain if your plot does not look like this picture.
In the picture the upper axis limit has been adjusted. To do this, go to Plot→Axis Range→Decrease Upper several times or use the shortcut keys <Alt>+<ArrowDown>.
You can also change and monitor the axis limits from the Plot Toolbar found at the bottom left in WinMLS (default position). Note: Push <Enter> to validate after typing a value in this toolbar.
Step 8 – Vertical Axis in dB
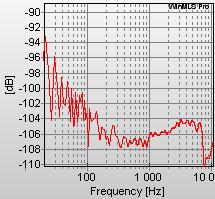 Some users want to display the (T)HD on a dB-scale as shown in the picture instead of percentage.
To do this, go to Plot→Plot Type Settings→Active Plot…. Select Vertical axis dB before closing.
After doing this, the upper and lower axis limits may probably have to be adjusted as explained in the previous wizard step.
Step 9 – Type of Harmonic Distortion
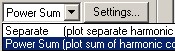 You can select to plot separate harmonic components or the total harmonic distortion (THD) that is named Power Sum as shown in the picture.
Go to: Plot→Plot Type Settings→Active Plot…. To measure THD, select Power Sum. To measure separate harmonics, select Separate.
Click the Settings… button shown in the figure to open the settings dialog. This dialog will be explained in the next wizard step.
While keeping the Settings dialog open, click the Next > button in this wizard.
Step 10 – Harmonic Distortion Settings
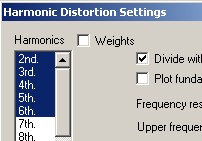 From this dialog (see previous wizard step on how to open it), you can select which harmonic components to be included.
For measuring THD, the 2-6 harmonics should be included as shown in the figure. Including more harmonics will normally not improve the result. For detecting rub and buzz, include the higher order harmonics and not the 2nd and 3rd.
Hold the <Shift> or <Control> key while clicking to select multiple components.
Note that if Plot fundamental is checked, the fundamental will also be plotted.
Step 11 – Smoothing
 Smoothing is applied as default. The smoothing makes the curve smoother, but may show a lower HD since the smoothing computes the mean value.
In the figure, the red curve shows the result when the smoothing is turned off.
To turn smoothing off or open the Smoothing Settings, go to Plot→Plot Type Settings→Active Plot….
You can also use the smoothing button found at the Active Plot Toolbar.
Step 12 – Quasi-Real Time Update
 For some applications it is useful to display the change in distortion by repeating the measurement.
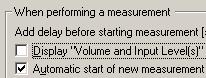
If you want to do this, go to go to Measurement→Tasks… and make sure that Automatic start of measurement after new measurement is checked as shown in the picture.
The next wizard step explains another method for doing this.
Step 13 – Fast Continuous Update
 You may update the curve faster than in the previous wizard step, but this requires that you are using a fast PC.
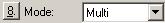
To set this, go to Measurement→Settings…. In step 8. Mode make sure Multi is selected as shown in the picture.
Note: This may not work on older PCs, if the PC hangs or crashes, change back from Multi to Single.
If you have problems stopping a measurement, push the Esc key several times.
Step 14 – Accuracy (optional)
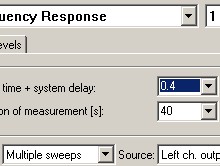 The accuracy of the default settings should be high. But the accuracy may be improved by increasing the measurement duration from Measurement→Settings…. In the picture the measurement duration is set to 40 seconds which should give an extreme high accuracy.
For measurements of long duration, select Multiple sweeps as shown at the bottom of the picture. Multiple sweeps will reduce both the file size and the computation time.
Note: Multiple sweeps may not work with all sound cards so you should compare the result with a measurement using Single sweep.
Step 15 – Multiple Sweeps (optional)
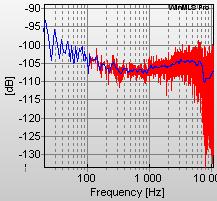
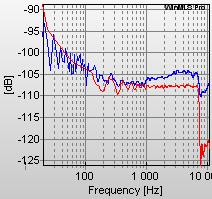 In the figure, the blue curve was measured using default settings and the red curve the settings in the previous section. The red curve has a lower frequency resolution and the level is lower at higher frequencies because the background noise is reduced due to the increased measurement duration.
The difference in results should be much less if the HD is higher than in this example.The reason for the decrease in HD above 7 kHz, is that only the 2 order HD is measured in this range (because the sampling frequency was 48 kHz). For this sound card the 2. order HD component is very low.
Step 16 – Increase Output Levels
 The output levels can be stepped automatically after each measurement to plot the HD as function of level.
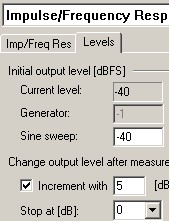
To do this, go to Measurement→Settings… and select the settings shown in the figure. This will increment the level from -40 dBFS to 0 dBFS in 5 dB steps. Click the Close button to exit.
Go to Measurement→Tasks… and make sure the check box Automatic start of new measurement after previous is checked.
Start measuring using Measurement→Start.
Step 17 – Results of stepping output
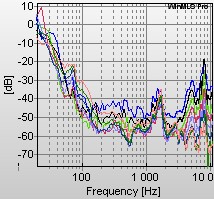 You should now see several curves as displayed in the figure.
The figure shows measurements of a loudspeaker element.
The HD normally increases with increasing output levels. But if the HD is small, measurement results may show the opposite. This is because the background noise is also included in the result. And the influence of the background noise is less if the sine sweep level is high.
Step 18 – Passed/Failed Testing
 You can specify a limit curve used for testing. If the distortion level at a certain frequency has reached this limit, the user will be notified.
Note: Only WinMLS level 7 support this.
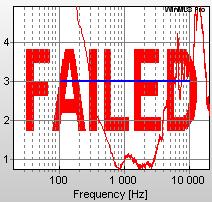
See the figure for a typical result. The blue limit curve is a horizontal straight line at 3 % from 100-10000 Hz.
The figure shows that the red HD-curve is above this limit for low and high frequencies. Thus the red Failed text appears in the plot. You can also notify the user by changing the background color or display a message box.
Step 19 – Passed/Failed Test
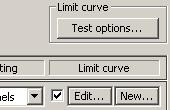 To turn on the Passed/Failed test, go to Plot→Plot Type/Routing/Test as shown in the figure. In this dialog:
1. Make sure the checkbox is checked as shown in the figure.2. Click the New… button to select a limit curve text file. 3. To edit the limit curve data, click the Edit… button.4. Click the Test options… button to set test options.5. Click the help button if you need more info.
Step 20 – Customize the Wizard
 If you want to restart the Wizard, do this from Measurement→Wizard→Start.
You can easily edit the Wizard to include your own spesific instructions from Measurement→Wizard→Editor….
Click help for more info.
If you want WinMLS to remember your settings, store the setup from Setup→Store….
Click the Finish button to exit this wizard.