Sound System – Spectrum Analyzer and dBC
Step 1 – Spektrianalysaattori ja dBC
The left plot displays the spectrum in 1/3 octave bands.
The right plot displays the level in dBC.
If you have a higher level WinMLS license, for more info load the setup named: Level (Noise)_Leq (dBA, dBC, etc., third oct. bands).
Click the Next > button to continue.
Step 2 – Preparation
 Connect the microphone to left channel sound card input (if it is a stereo input). The sound card output will not be used.
Click help if you have not already selected the sound card settings.
Click the Next > button to continue.
Step 3 – Calibration
 To measure the correct absolute levels, the input chain must be calibrated. If you only need to compare relative levels, you may skip this part.
Calibration can be done in different ways as explained if you click help. Here we assume that you are using a microphone and have a calibrator.
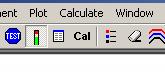
Then what you need to calibrate is to click the Cal button on the standard toolbar as shown in the figure. Follow the procedure to complete the calibration.
Step 4 – The Plots
![]() To the left, the spectrum is displayed as shown in the picture. The third-octave plot has added a cursor and a field that displays the cursor value.
To the left, the spectrum is displayed as shown in the picture. The third-octave plot has added a cursor and a field that displays the cursor value.
To the right, a dBC plot is displayed. The dBC plot gives the equivalent value (Leq).
For related information, load the setup named Sound System_Detect Feedback.
Step 5 – Fast Continuous Update
 If you have purchased a higher level WinMLS license, you may update the curve faster.
To set this, go to Measurement→Settings…. In step 8. Mode make sure Multi is selected as shown in the picture.
Note: This may not work on older PCs, if the PC hangs or crashes, change back from Multi to Single.
If you have problems stopping a measurement, push the Esc key several times.