Computing average and other statistics, such as STD, maximum and minimum, can be done in a spreadsheet by exporting the data, but it can also be done directly in the plot. Doing it directly in the plot is faster.
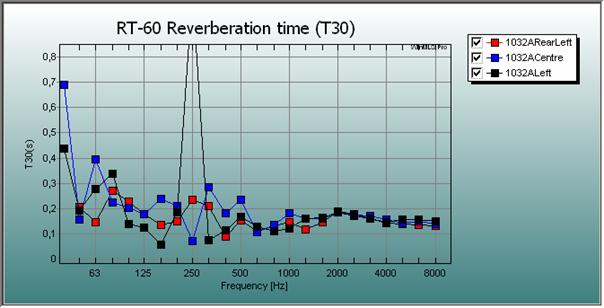
To do this, first plot
the curves you want to compute the mean value from. Make sure the  button is on so the curves are
plotted on top of each other. The
button is on so the curves are
plotted on top of each other. The  button should also be turned on to display the legend list shown
to the right in the figure below.
button should also be turned on to display the legend list shown
to the right in the figure below.
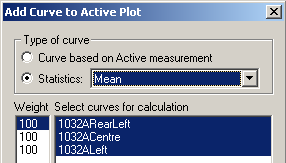
Now use Plot->Add Curve(s)... to open the dialog shown below
Select the radio button
 to plot statistics.
Then mark the curves you
want to include for computing the mean value. In the example above, all three
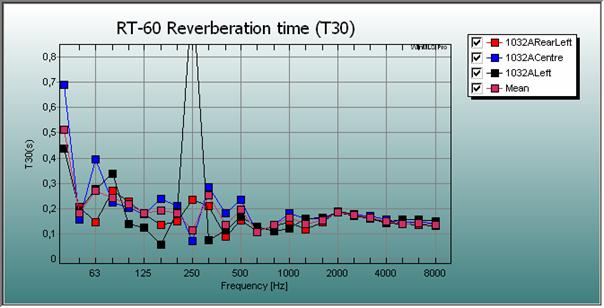
curves are marked initially. Then click the  button to add the curve and to exit the dialog. The new curve is
named Mean and is shown in the figure below
button to add the curve and to exit the dialog. The new curve is
named Mean and is shown in the figure below
 Contents
 Index
Index Search
 Previous
 Next
Next