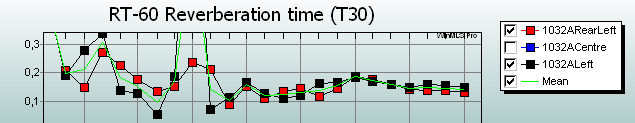
Statistics, such as mean value, can also be set to update automatically. It updates whenever there is a change in the curves in the plot, e.g. when a new curve is added. Note that the statistics are computed using the visible curves (the curves that are checked in the legend in the figure below, 1032ACentre is not checked and therefore not visible in the plot).
In other words, in the figure below, the blue curve is set to invisible (unchecked), therefore the auto-statistics is computed from the black and the red curves only.
To turn on the
auto-statistics, you may use the  button from the Standard toolbar.
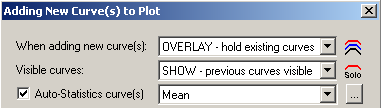
Open the dialog box containing the auto-statistics settings from Plot->Overlay Settings.... Make sure the settings are set as shown below.
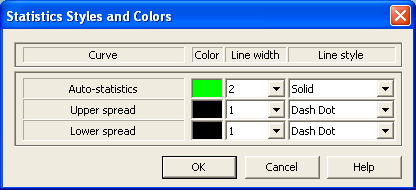
Click the  button to display the colors and
line styles for the Mean curve as shown below
button to display the colors and
line styles for the Mean curve as shown below
You may set the line width to at least 2 for the green Auto-statistics curve as shown above. A thicker curve will make it easier to separate the auto-statistics curve from the other curves.
Important: If you want to display only the mean curve
and not the other curves, the easiest method is to use the  button, or Plot->Solo
Curve. This is also useful if you want to export only the statistics
curves.
button, or Plot->Solo
Curve. This is also useful if you want to export only the statistics
curves.
If you want to display only the mean curve while deleting the
other curves, you must first turn off the auto-statistics from Plot->Overlay Settings.... Then delete the other curves. If you use the
button to turn off the
auto-statistics, the statistics curves are deleted from the plot.
 Contents
 Index
Index Search
 Previous
 Next
Next