You can also display the results in a table from the
Calculate... menu (select Calculate->Reverb Times (RT-60)... or
the  button as shown in the
figure below. The results from the active
measurement will be displayed, the name of this measurement is shown in the
title in the figure below.
button as shown in the
figure below. The results from the active
measurement will be displayed, the name of this measurement is shown in the
title in the figure below.
Click the  button if you want to copy the data to the clipboard and paste it
to a spreadsheet (for example MS Excel). You can also select an area in the grid
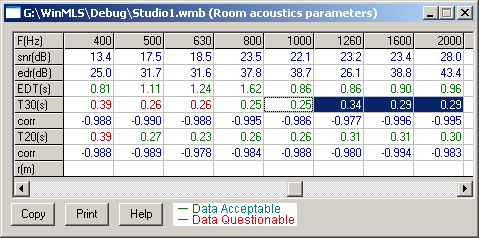
as shown in the figure above. Then click to copy only the data you have selected. In the figure above T30 for the bands 1000-2000 Hz is marked and will
thus be copied.
button if you want to copy the data to the clipboard and paste it
to a spreadsheet (for example MS Excel). You can also select an area in the grid
as shown in the figure above. Then click to copy only the data you have selected. In the figure above T30 for the bands 1000-2000 Hz is marked and will
thus be copied.
In this case three reverberation times are displayed, EDT, T30 and T20. EDT is the early decay range (evaluated using the decay curve range 0 to 10 dB) and should correlate well with the subjective impression of the reverberation.
If the edr number is better than 35 dB, T30 gives the decay time according the definition (starting point 5, decaying to 35). It is possible to specify this in more detail from Room Acoustics->User Defined->Settings....
The corr number should be as near 1 as possible, if it deviates from this it indicates that the reverberation curve is not a straight decaying line. An example of such a case is if the room you are measuring has a coupling to another room with a different reverberation time (e.g. if a large door is open between the two rooms).
If this is the case, you may select the Schroeder Curve plot type and from this see if it is possible to do the reverberation calculation in two parts. For example, the first calculation can be done in the range 5 to 23 dB and the second from -23 dB to 45 dB.
 Contents
 Index
Index Search
 Previous
 Next
Next