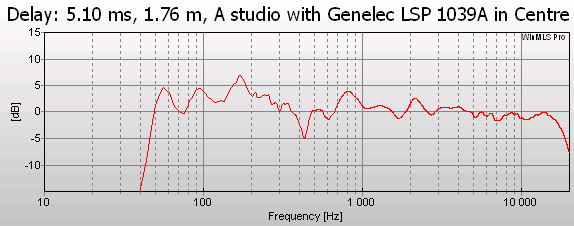
As we see in the title of the plot below, the delay is displayed in both milliseconds and meters.
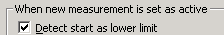
In order to display the delay in the title, go to Plot->Plot Type Settings->Time Window . In this dialog make sure the check box shown below is checked.
If the check box is not checked, the delay will not be displayed in the title.
Note: The delay displayed in the title is given by the start of the time window. This algorithm will include pre-ringing and may not always be correct. If you are in doubt, inspect the impulse response by displaying the Time Data plot type.
 Contents
 Index
Index Search
 Previous
 Next
Next