The plot
type Group Delay displays the delay in milliseconds as a function of
frequency. In case of a simple impulse response,
such as for a sound card, plotting the group delay
will give the initial time delay with accuracy
better than 1 sample as shown below. The delay can be found by reading the value
at the vertical axis at e.g. 1000 Hz. (In the plot below the group delay is
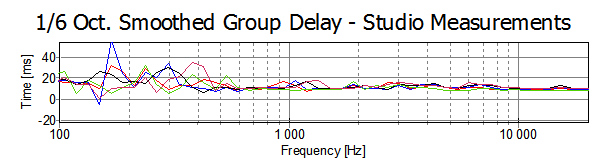
smoothed in 1/6 octaves.)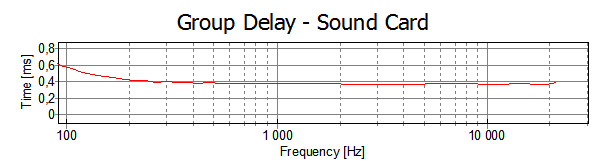 But for
more complicated impulse responses, the curves are more complicated. Shown below
is the result from the measurements used as examples in the sections above. We
see that the delay changes somewhat as function of frequency.
But for
more complicated impulse responses, the curves are more complicated. Shown below
is the result from the measurements used as examples in the sections above. We
see that the delay changes somewhat as function of frequency.
 Contents
 Index
Index Search
 Previous
 Next
Next