We recommend that you plot the impulse response using dB on the vertical axis and milliseconds on the horizontal axis. Furthermore you can normalize the vertical axis so the direct sound is set to 0 dB (assuming that the direct sound is stronger than the reflections).
Open the plot type settings by clicking in the active plot and hit the F5 key and make sure the settings is set as shown below.
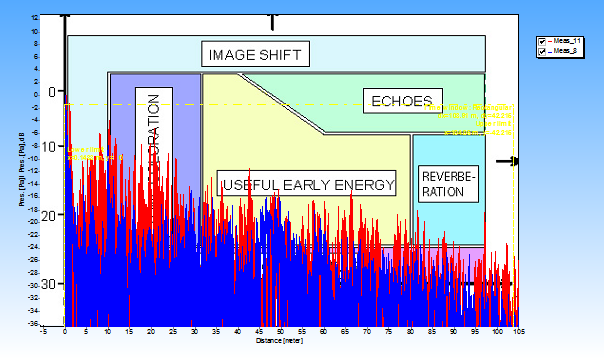
Then the early reflections can be found as peaks in the plot as shown below.
In the example above, we have added a background picture that indicates where you have coloration, image shift, useful early energy, echoes and reverberation.
To this background picture, go to Plot->Plot Type Settings->Time Window to display the time window settings.
Note that to use this map properly, you have to set the time
window lower limit to the direct sound (usually the first strong reflection).
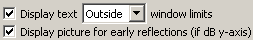
This is done automatically when a measurement is inserted if  is checked in the time window
settings.
is checked in the time window
settings.
Note: The time window start detection is updated when
room acoustics parameters are calculated. (This detection algorithm is slightly
different than the detection)
 Why does the relative axis of the map not always quite follow the yellow time limit line?
 Contents
 Index
Index Search
 Previous
 Next
Next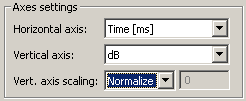
 is checked.