When Frequency
Response/Spectrum is selected as the active plot
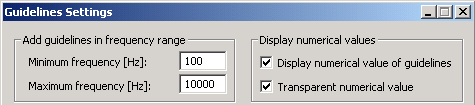
type, guidelines can be added. Go to Plot->Plot Type Settings->Frequency
Response/Spectrum
. Then click the guidelines  button to open the dialog
shown below.
button to open the dialog
shown below.
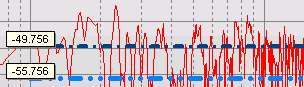
The numerical values are
displayed if  is checked as
shown to the left in the figure below.
is checked as
shown to the left in the figure below.
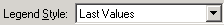
To display the numerical value of these lines can also be done in the legend as shown below
To do this, go to Plot-> Layout->Edit... and click the Legend tab. In the Legend Style list box choose Last Values as shown below.
This means that the last value of the series will be displayed in the legend and not the curve name. Since the guidelines are straight lines this is the value of the guideline.
 Contents
 Index
Index Search
 Previous
 Next
Next