You can find the maximum frequency (e.g. the feedback frequency) from the Frequency Response Spectrum plot type.
Go to Plot->Layout->Advanced.... In this dialog
box, make sure  is checked.
This will update the cursor with the maximum value each time you perform a new
measurement.
is checked.
This will update the cursor with the maximum value each time you perform a new
measurement.
If you want to add a cursor, make sure that Plot->Layout->Cursor is checked.
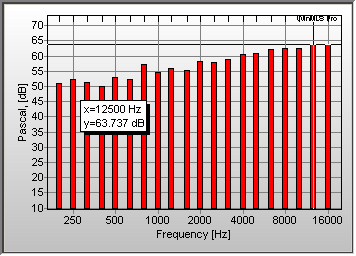
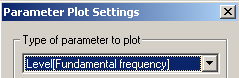
You can also find the frequency with the highest gain by selecting the Parameters plot type. Select the Parameters plot type in the list in the Plot Toolbar. Go to Plot->Plot Type Settings->Parameters and select as shown below.
This will display the frequency on the horizontal axis and the level on the vertical axis.
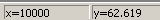
The frequency and level will also be displayed in the status bar.
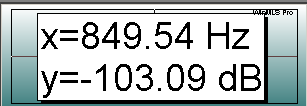
For all the plot types you can add a textbox that will contain the numerical values as shown below.
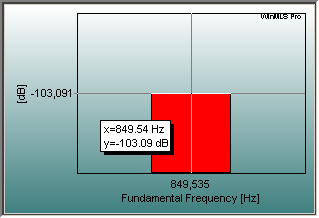
How to do this is explained in a section below. You can easily change the font of the text. In cases where you have to be far away from your PC and dont see well, we recommend that you use a large text font, for example as shown below.
In the figure above we have covered the whole plot with the text. This is useful if you only want the numerical value of the frequency and gain.
To do this we removed the axis.
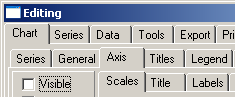
This is done from Plot->Layout->Edit, select the
Chart and Axis tabs, then make sure  is not checked as shown below.
 Contents
 Index
Index Search
 Previous
 Next
Next