Perform or open the two measurements you want. Select Frequency Response - Spectrum as plot type and set one of the measurements as active measurement. This can be done in the Measurement Selection Toolbar or in Measurement->Information .
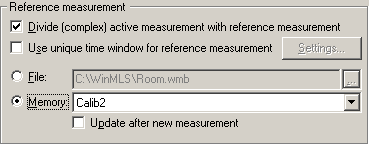
The other measurement must then be set as the reference measurement. Do this from the lower part of Plot->Plot Type Settings->General Frequency Domain... dialog box. The Reference measurement part of the dialog box is shown below.
Make sure  is checked. The in the list box
shown above, select the desired divisor measurement (Calib2 is selected
in the example above). If you want to use an individual window setting on the
reference measurements, make sure
is checked. The in the list box
shown above, select the desired divisor measurement (Calib2 is selected
in the example above). If you want to use an individual window setting on the
reference measurements, make sure  is checked. Then click the
  button to display the time window settings for the reference
measurement.
button to display the time window settings for the reference
measurement.
When the dialog box is
exited with  you should now
see the level difference between the measurements as function of
frequency.
you should now
see the level difference between the measurements as function of
frequency.
If you want to display the transfer function in octaves or 1/3-octaves, see the How to display the level in octave bands? section.
 When dividing the same measurement, why is the result not a flat line?
 Contents
 Index
Index Search
 Previous
 Next
Next