Note that the method that will be described only works if the data has exactly the same vertical axis values. Also note that if a value is missing, it is set to zero. This can be a problem e.g. when calculating the average of reverberation times, if some values are not plotted because the signal-to-noise ratio (SNR) is poor. Therefore we recommend that you use the statistics feature in Plot->Overlay Settings or Plot->Add Curve(s) for such purposes. That feature is also much easier to use.
First plot all the
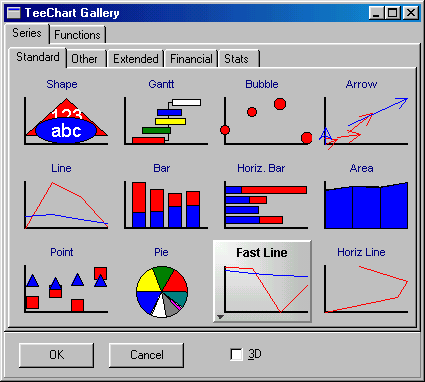
curves you want to perform calculations on and go to Plot->
Layout->Edit.... In the dialog box, you will see the list of the
plotted curves/series. Generate a new curve/series by clicking the  button. Then select series
type, e.g. Fast Line as selected in the figure below.
button. Then select series
type, e.g. Fast Line as selected in the figure below.
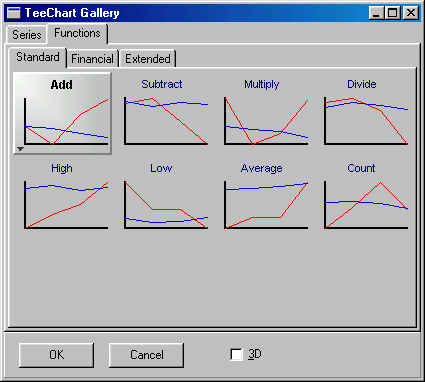
Click on the Functions tag in the upper part of the dialog box. You can select from three tags containing different mathematical functions, Standard, Financial and Extended as shown in the figure below.
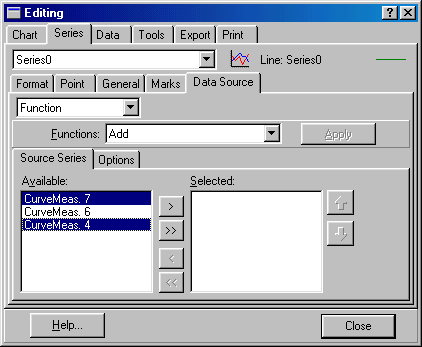
Double-click on the type of mathematical function you want, e.g. Add (see above). After double-clicking, you will go to the series properties shown below.
In the Source Series tab, mark the series you wish to do the computation on (in the figure above CurveMeas. 7 and CurveMeas. 4 have been marked).
Now use the  button to move them to the
Selected: list. If you want to move all measurements use the
button to move them to the
Selected: list. If you want to move all measurements use the  button.
When this is done, click
the  button to exit the
dialog box. You will now see the new series in the plot.
button to exit the
dialog box. You will now see the new series in the plot.
You can change the title
of the new series by clicking the  button in Plot->Layout->Edit.....
 Contents
 Index
Index Search
 Previous
 Next
Next