The energy of an impulse response or the power of a stationary signal or noise can be plotted in octave or one-third-octave bands if Frequency response/Spectrum is selected as the plot type.
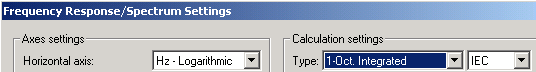
Go to Plot->Plot Type Settings->Active Plot to display the plot settings dialog box. Select 1-Oct. Integrated or 1/3-Oct. Integrated as shown below.
 Contents
 Index
Index Search
 Previous
 Next
Next