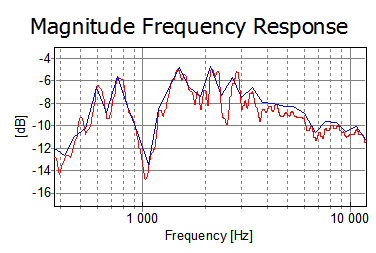
This is done by interpolating a smooth curve through the smoothed points (see red curve below) rather than straight lines from point to point (blue curve).
Please note that the smoothing can be applied to all the frequency domain plots (phase, group delay, waterfall).
Go to Plot->Plot Type
Settings->Active Plot
to display the plot
settings dialog box. Make sure  is checked as shown in the figure below. Click the
  button also shown in the
figure below.
button also shown in the
figure below.
In the dialog box, select smoothing type as shown below (it will interpolate the data so the curve will look very nice).
Note: This slows down the plotting and should not be used if you have set WinMLS to measure and update the plots in real time.
 Contents
 Index
Index Search
 Previous
 Next
Next