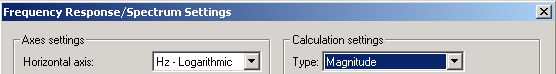
Go to Plot->Plot Type Settings->Active Plot to display the plot settings dialog and select Magnitude as shown below.
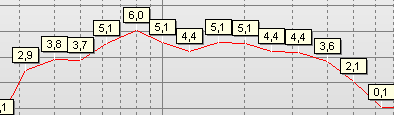
Note: You may also include marks on each frequency value as shown in the figure.
To do this, make sure the check box shown below is checked
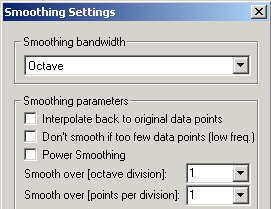
In the same dialog box, find the smoothing settings shown below.
Make sure  is checked and click the
  button shown in the figure
above.
button shown in the figure
above.
In the new dialog, select smoothing type as shown below (it will plot 1-octaves at the standard center frequencies).
Note if  or
or  is
checked, the center frequencies will not be the standard IEC frequencies.
is
checked, the center frequencies will not be the standard IEC frequencies.
Click the  button to exit the dialog boxes.
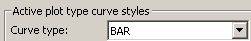
Finally the plot can be displayed in bars instead of a line. To do this, go to Plot->Layout->Curve Styles and Colors and select the curve type BAR as shown below
 Contents
 Index
Index Search
 Previous
 Next
Next