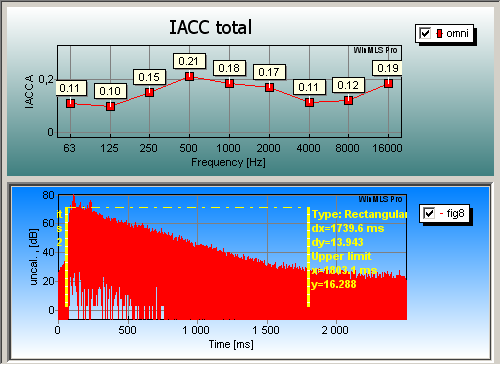
An example of a plot needing two impulse responses is shown below.
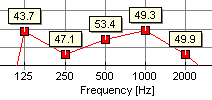
If displaying edr in marks in the plot, only edr for the primary impulse response is displayed in the plot in case two impulse responses are used in computing the parameter as shown in the figure below.
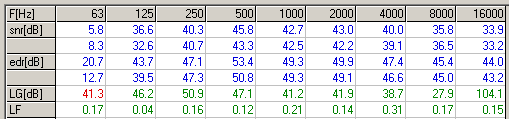
In the table, both signal-to-noise ratios are displayed as shown in the figure below.
If you intend to plot room acoustical parameters in the lower plot, the active measurement in the lower plot is used as the primary measurement and if two measurements are needed to calculate the parameter, then this will give an error message. Instead, perform the plotting in the upper plot when computing parameters needing two impulse responses are to be plotted.
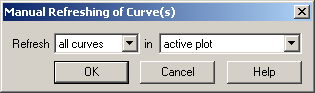
There is still a problem if several curves are plotted and
Plot->Refresh
is selected with the setting  as shown below.
Each curve will not remember what was used as secondary
measurement when it was plotted, therefore the active measurement in the lower
plot will be as the secondary plot when refreshing all the curves. Therefore,
use the setting instead of
 .
.
 Contents
 Index
Index Search
 Previous
 Next
Next