
This toolbar should be very useful. It contains settings for
scaling in horizontal and vertical direction
selecting one or two plots to be displayed in the window
which plot type to be active
accessing the settings of the active plot type.
In the figure below we see a plot with this toolbar on top.
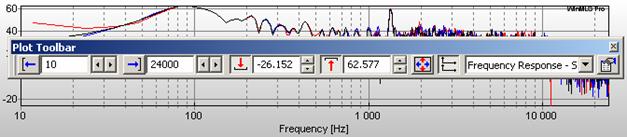
Note: If two plots are plotted in the current window, the settings for the active plot will be displayed in the toolbar. If you have two plots displayed, it is a good exercise to click in the other plot to set it active and see how the toolbar settings will change.
 Setting the lower x-axis limit
Setting the upper x-axis limit
Setting the lower y-axis limit
Setting the upper y-axis limit
 Contents
 Index
Index Search
 Previous
 Next
Next