 Setting the lower x-axis limit
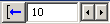
The controls shown above are used to set the lower x-axis limit.
If auto-scale lower x-limit
 is toggled, the minimum
x-value of any of the curves in the plot will be used as minimum value. The edit
window
is toggled, the minimum
x-value of any of the curves in the plot will be used as minimum value. The edit
window  shows the current
value, 10 Hz in this example. It is possible to type a new value, but remember
to validate it by pressing Enter.
shows the current
value, 10 Hz in this example. It is possible to type a new value, but remember
to validate it by pressing Enter.
The controls  are used for moving the lower
limit in either left or right direction.
are used for moving the lower
limit in either left or right direction.
 Contents
 Index
Index Search
 Previous
 Next
Next