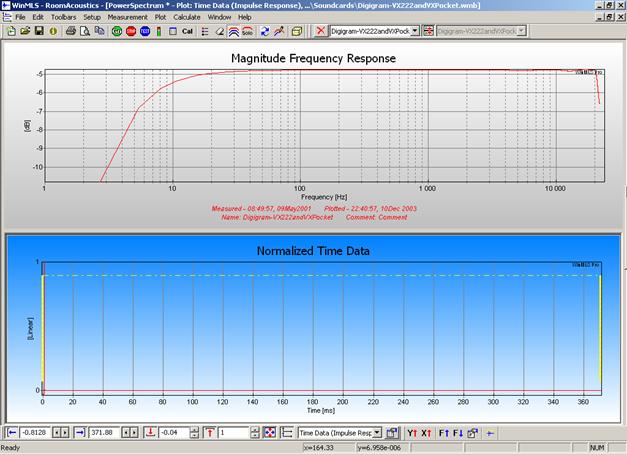
When the measurement is finished, it should look similar to the figure below.
Figure 1 Screenshot after loop-back measuring the Digigram VX222 v2 sound card.
The red curve in the upper plot displays the magnitude frequency response of the sound card. The lower plot displays the impulse response. We see that the impulse response seems to be very short and the frequency response is very flat in the range 20 to 20000 Hz.
 Contents
 Index
Index Search
 Previous
 Next
Next