The statistics of the visible curves in the plot will
automatically be computed if  is checked as shown below.
Note that this setting depends on the selected plot type (e.g. phase or frequency response). This means that you have to click in the plot to set it active and then open this dialog box to turn on the statistics.
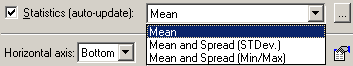
You can select from three different types of statistics as shown in the list below.
Click the  button to open the curve styles dialog for the statistics curves
as shown next.
button to open the curve styles dialog for the statistics curves
as shown next.
 Contents
 Index
Index Search
 Previous
 Next
Next