Displays the dialog shown below.
The styles and colors is set for the Auto-statistics curve (which is the Mean value) and the Upper and Lower spread.
The color of the curves is set by
clicking at the color field  . The
line width is selected from the line width
. The
line width is selected from the line width  list box. Note that if you are plotting statistics of a curve
that consists of >50000 points (e.g. the time data plot type), a line width larger than 1 will make the
plotting slower.
list box. Note that if you are plotting statistics of a curve
that consists of >50000 points (e.g. the time data plot type), a line width larger than 1 will make the
plotting slower.
The line style is selected from
the line style  list
box.
list
box.
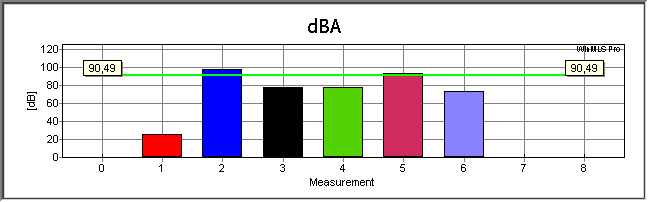
If plotting parameters that has only one value, the mean value will be displayed as the green line shown in the figure below.
The statistics line in the figure above has numbers (marks) that display the value. This is set from Plot->Plot Type Settings->Frequency Response/Spectrum . In this dialog box, click the button shown below.
This will open a dialog displaying the settings shown below.
 Contents
 Index
Index Search
 Previous
 Next
Next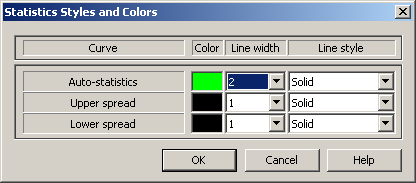

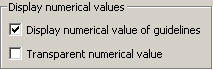
 is checked, the numbers will be
displayed.
is checked, the numbers will be
displayed.