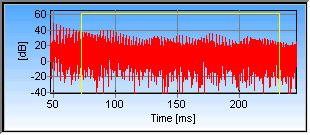
If  is
checked, the time data window is displayed in the Time Data plot type as shown below. The time data window
consists of the three yellow lines and it is valid for the active measurement (there may be more than one
measurement in the window and these may have different time data
windows).
is
checked, the time data window is displayed in the Time Data plot type as shown below. The time data window
consists of the three yellow lines and it is valid for the active measurement (there may be more than one
measurement in the window and these may have different time data
windows).
The window start and end points can be set directly by clicking and dragging with the mouse. In order to do this, move the mouse pointer on top of the vertical line that is to be moved. The mouse pointer will change shape when it comes near the limit.
In order to make sure auto-scaling of the y-axis can be maintained, the vertical start and end lines are kept within the curve area. The whole window is thus visible if auto-scaling is used.
Click the  button to access the time window settings Plot->Plot Type
Settings->Time Window
.
button to access the time window settings Plot->Plot Type
Settings->Time Window
.
 Contents
 Index
Index Search
 Previous
 Next
Next