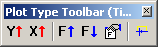
If the selected plot type is time data, integrated time data (step response), energy-time-curve or Schroeder curve, the toolbar will look as shown below
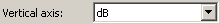
 Change y-axis. Same as
 found in the plot
type settings (press the F5 key to open the dialog). One click on the
button sets the
vertical axis to one of the settings shown below
found in the plot
type settings (press the F5 key to open the dialog). One click on the
button sets the
vertical axis to one of the settings shown below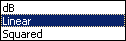
 Change x-axis. Same
as
Change x-axis. Same
as 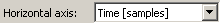 found in the plot
type settings (press the F5 key).
found in the plot
type settings (press the F5 key).
 Increase filter frequency. If filtering is turned off, clicking this
button will turn on filtering and set the lowest filter frequency. Turn off
filtering by clicking several times. Click the
Increase filter frequency. If filtering is turned off, clicking this
button will turn on filtering and set the lowest filter frequency. Turn off
filtering by clicking several times. Click the  button to set the filter type and
step used for each click (e.g octave or 1/3 octave).
button to set the filter type and
step used for each click (e.g octave or 1/3 octave).
Decrease filter frequency. If filtering is turned off, clicking this
button will turn on filtering and set the highest filter frequency. Turn off
filtering by clicking several times. Click the button to set the filter type and
step used for each click (e.g octave or 1/3 octave).
Filter settings. For
details see the Plot->Plot Type Settings->Time Data....
documentation.
 Time window settings. For details see
Plot->Plot Type Settings->Time Window
.
Time window settings. For details see
Plot->Plot Type Settings->Time Window
.
 Contents
 Index
Index Search
 Previous
 Next
Next